Wow, time flies! It’s hard to believe that three years have passed since we first launched Poly Lens. From the outset, our mission has been to help you optimize your collaboration experiences. We understand that the success of your collaboration strategy hinges on the health and utilization of your deployed devices, which is why we have made it one of our top areas of focus.
To help you with that, starting today, Poly Lens offers a whole new way to visualize your data using the powerful tools built into Power BI. Visual Analytics with Power BI gives you the flexibility you need to supercharge your team's analytics with greater visualization and more insights around your Poly Lens data in a way that is more familiar to you. Included with Poly+ Enterprise and Elite services, you can now use the new Visual Analytics tool with Power BI to see your inventory of Poly headsets, conference phones, and video devices in a whole new light. Easily build reports based on device adoption, status, or inventory data or combine with other data sets to create a single pane of glass for your collaboration systems.
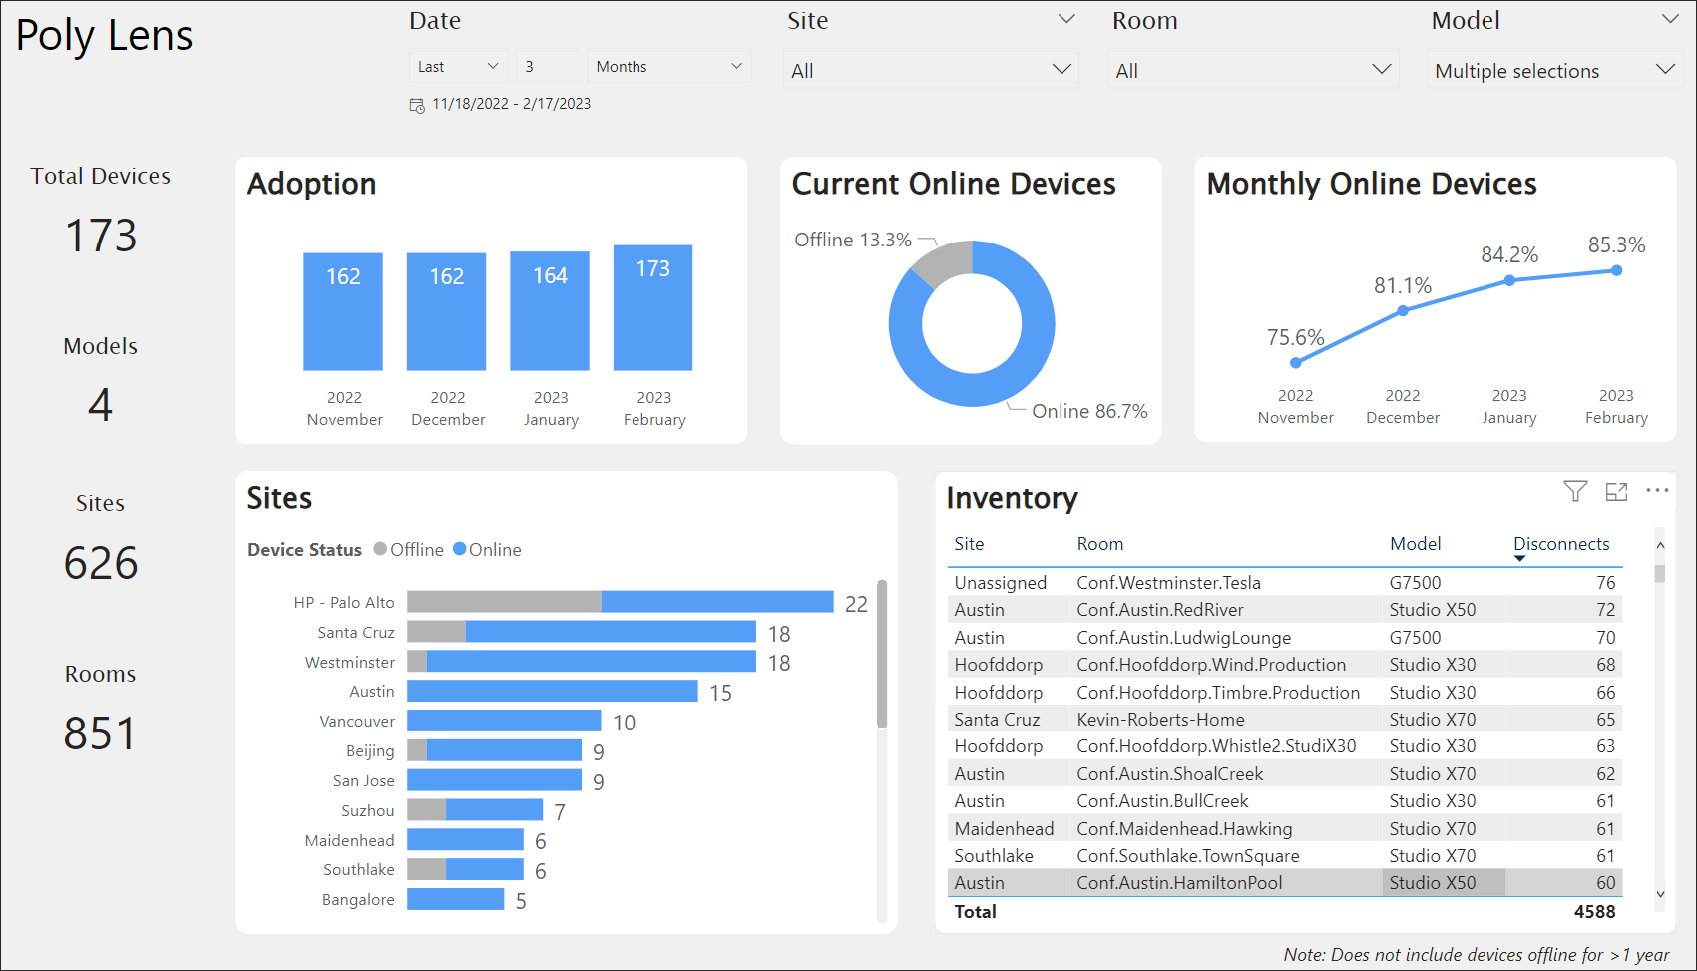
Setup is easy, and you'll love the starter dashboards designed to get you started with instant visualizations of your Poly Lens inventory. Don’t use Power BI? No problem, you can connect your preferred analysis tool to your Poly Lens Visual Analytics database to gain access to your device telemetry data and visualize it in a supported tool that works for you.
To get started, find the new tool by going to Go to the ACCOUNT menu > Manage Accounts. Select an Account from the list. Select Integrations > Visual Analytics.
For more information on how to get started, data organization, and schema diagrams, visit Poly Lens Help - Visual Analytics.
Note: Access to the Visual Analytics tool with Power BI is delivered as part of Poly+ Enterprise and Elite services.